Rabinowitz/Raphael labs map tissue metabolism at cellular resolution
Seizing on an imaging technology that allows scientists to identify individual small molecules, the Rabinowitz Lab in collaboration with the Raphael Lab has for the first time mapped metabolites in two organs at high spatial resolution, tracking their metabolic fate in the small intestine and the liver.
Their research contributes a significant step towards building a chemical and artificial intelligence technology that captures the spatial metabolic organization of any organ.
Key to the work is a technology called MALDI, which researchers advanced to find the sweet spot between high spatial resolution and sensitivity to map out these small molecules.
In the process, they uncovered the adverse impact excess fructose—simple sugar—can have on the mammalian system as it makes the journey.
Paper: “Spatial metabolic gradients in the liver and small intestine.”
Journal: Nature, published October 2025.
Laith Samarah, a postdoc under Josh Rabinowitz and first author on this Nature paper.
Authors: Princeton Chemistry in collaboration with Princeton Computer Science: Laith Samarah, Clover Zheng, Xi Xing, Won Dong Lee, Amichay Afriat, Uthsav Chitra, Michael MacArthur, Wenyun Lu, Connor Jankowski, Cong Ma, Craig Hunter, Michael Neinast, Daniel Weilandt, Benjamin Raphael, and Joshua Rabinowitz.
What it is: Researchers captured high-resolution images of over 100 metabolites—among them fructose, glucose, malate, and glutamine—in the liver and gut. The microscopic structure of both these organs, central for nutrient processing, is highly organized. In the gut, tiny, finger-like projections called villi increase the surface area for nutrient absorption. Nutrients that are absorbed there pass to the liver where they are processed as they move sequentially through three different zones of liver cells. Disruptions in this organization can adversely impact the biological functions of these organs, so having a tool that helps scientists understand the spatial organization of the “neighborhood” is an essential step in disease prevention.
Using a special type of mass spectrometer, researchers generated images that enabled them to locate each metabolite along the digestive route. They collaborated with the Ben Raphael Lab in the Department of Computer Science to develop computational tools for precise analysis of the data.
How they did it: Researchers used an imaging technique called MALDI imaging mass spectrometry to create “beautiful” images of metabolites in the small intestine. MALDI stands for Matrix Assisted Laser Desorption Ionization. It uses a laser to eject molecules from microscopic spots and then ionizes them, creating an image for each metabolite. Hundreds of metabolites were detected.
The Raphael Lab: To corral the massive amount of data generated, the Raphael Lab devised a special AI-based algorithm that is trained to reconstruct the microscopic organization of the organs based on the MALDI data. The algorithm in turn allowed researchers to track and interpret what happens to each metabolite they were following down the digestive highway.
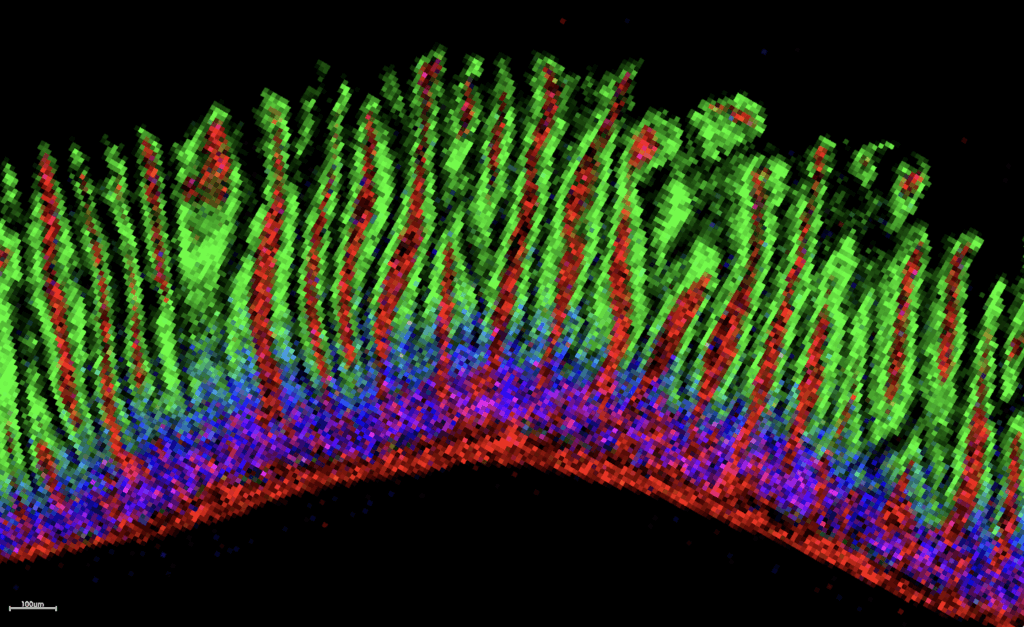
Up close and personal: a MALDI image of a mouse intestine displaying three different metabolites, each shown in a color (red, green or blue). The metabolites outline specific features in the finger-like villi. For example, the metabolite in green highlights the intestinal lining, whereas the metabolite in red defines vessels.
Comment from first author Laith Samarah, postdoctoral researcher: “I was interested in studying fructose, the sweet stuff. It is everywhere – a major energy source, but it’s also associated with diabetes and obesity. So I wanted to understand what it’s doing to the liver, because that’s one of the first organs to be hurt by excess fructose.
“We previously knew that when we consume fructose, the intestine processes it up to a certain capacity. If we consume more than this capacity at once, for example when we drink a large soda can, some of the excess fructose is shipped to the liver, where it is further processed. What we found here is that processing capacity for fructose also occurs within the liver, at the microscopic scale. The periportal cells in the liver, located near the entry point, are able to efficiently metabolize fructose only up to a certain capacity. Beyond this capacity, fructose is shipped to the next zone—the pericentral cells in the liver. And what we found is that these distal cells go into energy stress when they take up a large dose of fructose.”
Comment from Professor of Chemistry Joshua Rabinowitz: “In this paper, we developed technology to visualize metabolic activity at single-cell resolution. This involved combining advanced imaging mass spectrometry measurements with new AI-algorithms for data processing from Ben Raphael’s lab. We applied these methods to investigate baseline metabolic gradients in key nutrient-processing organs, the intestine and liver. Strikingly, in the liver we observed severe focal energy stress when mice consumed fructose, illustrating the capacity for soda or juice consumption to disrupt liver metabolism.”
Next steps: While scientists were able to identify and map over 100 metabolites at a spatial resolution high enough to capture the microscopic structure of the liver and gut, there is more information hidden at higher resolution. Researchers are advancing the technology to begin teasing out cells that differ from one another. Samarah believes this will be an excellent jumping-off point for continued research into metabolic function at the cellular level.
Funding: Research was funded by Ludwig Cancer Research, Chan Zuckerberg Initiative (2023-331955), Hevolution Foundation Geroscience (HF-GRO-23-1199192-1), U Penn Diabetes Research Center (NIH/NIDDK P30DK019525) and Rutgers Cancer Center (NIH/NCI P30CA072720).